Dashboard
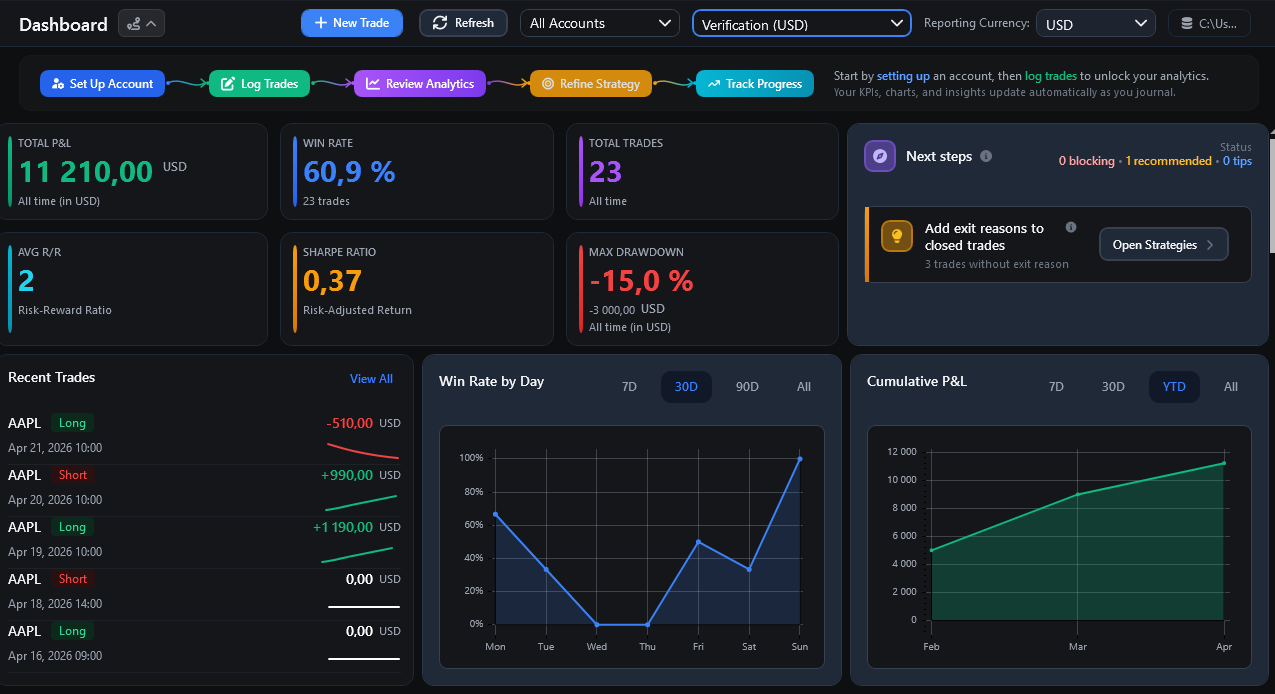
Home / Dashboard is the current performance-review screen. It combines KPIs, charts, recent activity, filters and data-quality guidance.
Closed Trades and Open Trades
Core realised performance KPIs use closed trades. Open trades can remain visible in activity or trade-review contexts, but they do not contribute realised Gross/Net P/L to closed-trade statistics.
Filters
Dashboard values respond to the visible controls, including:
Account Filter - Live Only, Demo Only or All.
Account Selector - one account or All Accounts.
Reporting Currency - currency used for combined monetary reporting.
Date/range controls where shown on a specific card or chart.
The selected filters can change which trades are included and which currency conversions are required.
Key Performance Indicators
Visible KPI cards can include:
Total P/L - combined net realised P/L for the selected scope.
Win Rate - percentage of included closed trades with positive realised result.
Total Trades - number of included closed trades.
Avg R/R - average stored risk/reward value for trades where it is available.
Sharpe / rolling risk-adjusted metrics - shown only when enough usable data exists.
Max Drawdown - largest peak-to-trough decline for the selected scope and currency mode.
Do not treat an unavailable metric as zero-quality trading data. Some values require enough closed trades, loss data, Stop Loss values or exchange rates.
Reporting Currency and Missing FX
When Dashboard combines accounts or currencies, FTJ uses rates stored in Rates.
If a trade cannot be converted:
FTJ does not silently add incompatible currencies together;
the trade can be excluded from reporting-currency monetary calculations;
a subtitle or guidance item can show the number of excluded trades.
Add or fetch the missing rate in Rates and refresh the Dashboard.
Guidance / Next Steps
The guidance panel can highlight data-quality or setup work, such as:
adding the first trade;
fixing missing exchange rates;
defining strategies/confluences;
assigning exit reasons;
completing important trade fields;
reviewing lot/contract-size settings;
backing up the database.
Guidance is based on journal completeness. It is not trading advice and does not evaluate whether a market setup should be taken.
Recent Activity
Recent activity can include open and closed trades. Selecting an item opens the related trade for review.
Charts
The exact visible charts depend on the current build, data and selected filters. Current Dashboard chart areas can include cumulative P/L/equity progression, win/loss summaries, per-trade results and other performance breakdowns.
Charts can show an empty-state message when no usable data exists. Do not direct users to a separate Analytics or Calendar sidebar page; those are not current navigation destinations.
Demo Mode
Dashboard review remains available at every Demo Mode trade count, including above 20 persisted trades. The trade-count limit controls new creation/import and core editing; it does not hide existing performance data.